Recognition methods
You can choose one of seven recognition methods depending on your goals and conditions.
7-segment
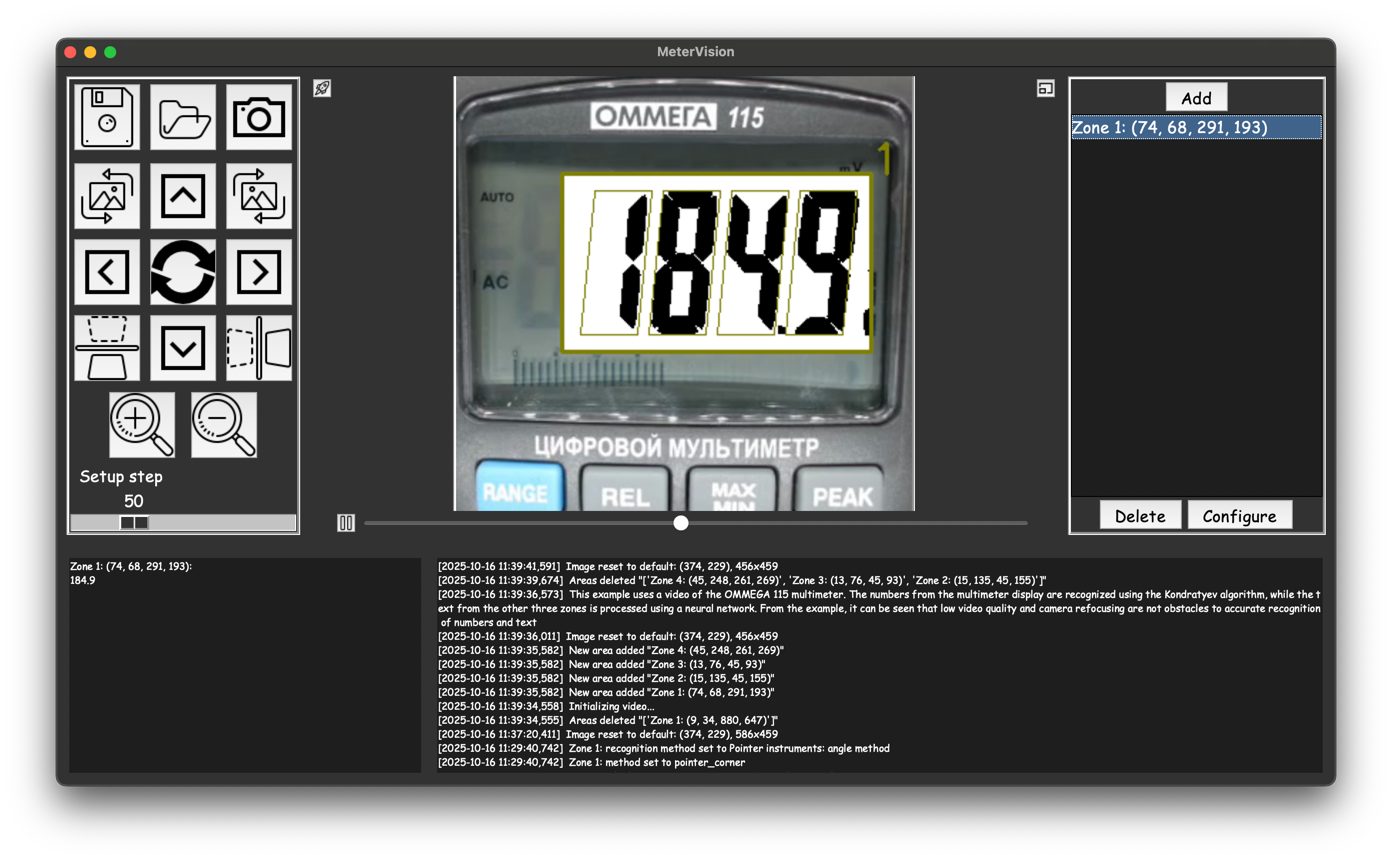
The most preferred, reliable, and fast method for recognizing seven-segment fonts and similar ones used in most types of digital displays.
Note
For this method to work correctly, the digits in the processed image must be black and the background white. If this is not the case, check/uncheck the Inversion checkbox (Configure).
Grid setup
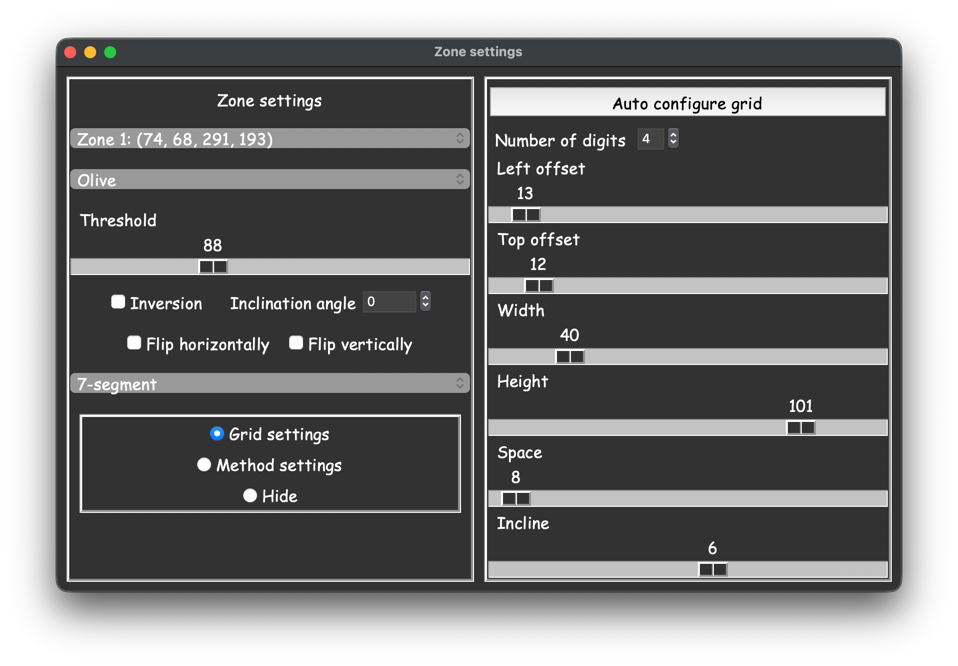
To configure this method, you first need to go to the Grid settings tab, then specify the number of digits to recognize and adjust the grid by the outer contour of the digits using the sliders Left offset, Top offset, Width, Height, Space, and Incline. The dot should be outside between the parallelograms. Examples of proper setup are built into the program.
You can also configure the grid automatically by clicking the corresponding button. The algorithm that builds the grid automatically contains random values, so it makes sense to press this button several times until a satisfactory result is obtained.
Note
The grid setup is implemented in such a way that the grid cannot go beyond the zone boundary. Therefore, for example, if you need to increase the left offset while the right edge of the grid already touches the right side of the zone, you will not be able to do this. You should first decrease the width or the space.
Method settings
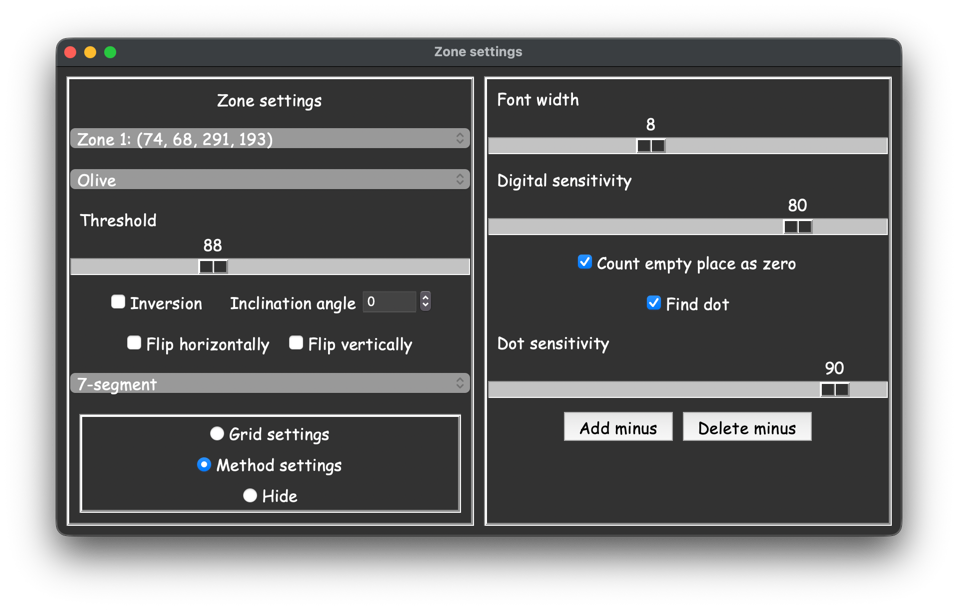
Next, select the Method settings tab. There are sliders Font width and Digital sensitivity, which are generally well-tuned by default and in most cases do not need to be changed. However, if in your case the recognition is unstable, you can adjust them. The font width should be increased if your font uses thick lines and decreased if they are thin. It is recommended to increase sensitivity if your image is dim but without noise; conversely, sensitivity should be decreased if the digits in your image are quite clear but there is also noise. It is important that the number of noise pixels does not exceed the pixels of the digits themselves.
If the Count empty place as zero checkbox is checked, a completely white field inside a certain grid parallelogram will be displayed as zero in the recognition results; otherwise it will be shown as an empty character.
With the Find dot checkbox you can configure the program to ignore the dot or display it in the results.
The Dot sensitivity slider configures the dot search according to the following logic. If there are black pixels between two parallelograms of the grid at the bottom border, then the higher the sensitivity, the fewer pixels are required to consider these pixels a dot. For example, a single pixel is enough for it to be detected as a dot if the dot sensitivity is set to 100. Adjust this parameter based on how bold your dot is and how much noise there is. As a rule, the default value of this parameter is suitable for most cases, so change it only if necessary.
To add minus recognition, click Add minus and select with two clicks a rectangle inside the current zone (only one minus can be selected and only inside the configured zone) where the minus should be located. To delete the minus, click Delete minus.
Note
After all settings, do not forget to save them in File, then you will not have to configure everything again when reusing this measuring instrument.
Pointer instruments: corner method
This method is used for pointer (analog) measuring instruments and works as follows:
Background removal relative to the moving object (the pointer). To correctly determine the background, the program needs to process a certain number of frames.
Search for feature points — corners.
Search for a straight line passing through the found corners. Not all points participate in constructing the line, but only those that lie no farther than a certain number of pixels from the line.
Accumulation of statistics of the found lines, search for the center — the axis of rotation of the pointer.
Conversion of the pointer inclination angle to results on the scale, according to the selected graduation method (if necessary).
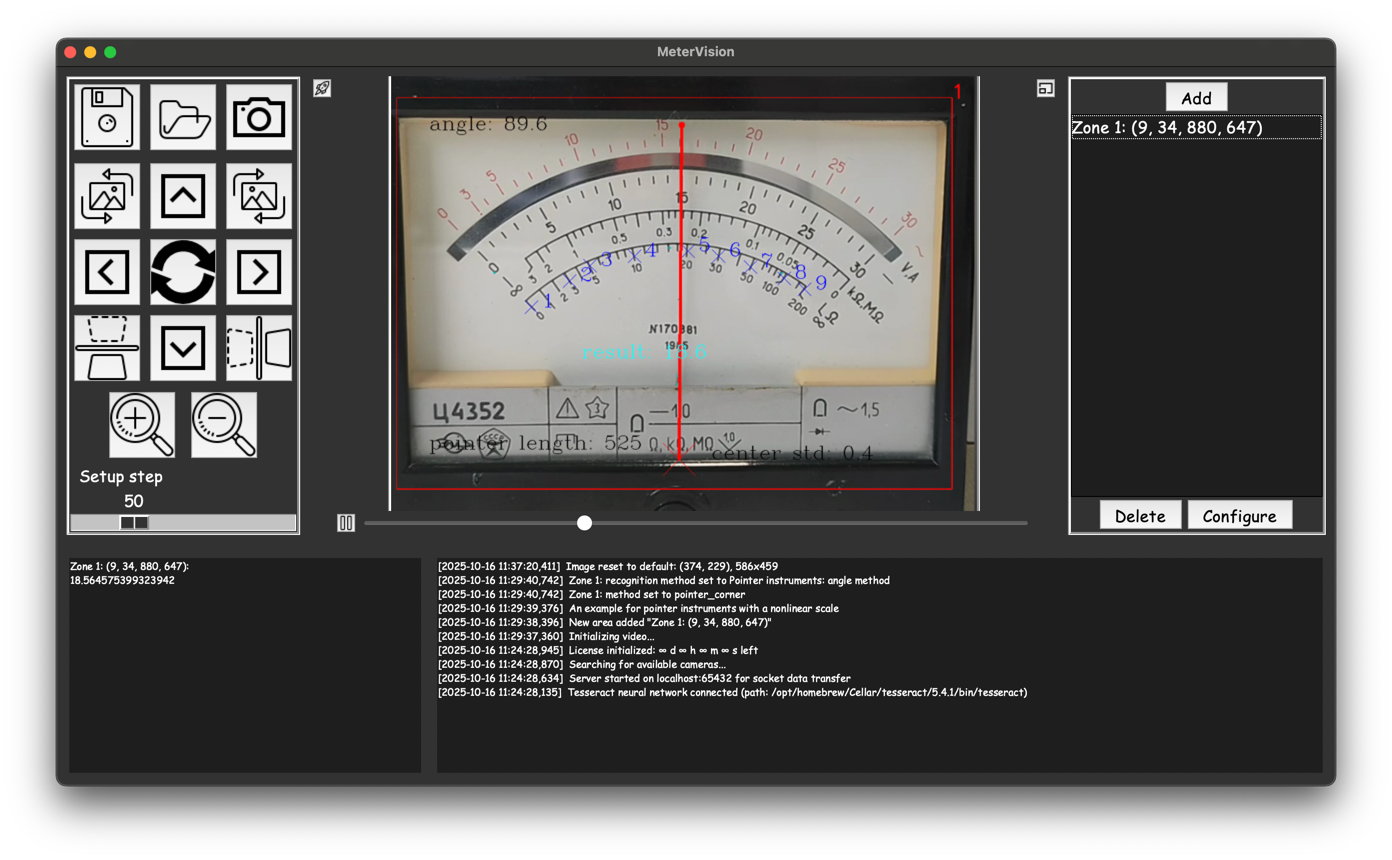
For successful implementation of this method and its wide application in the program, 3 additional settings menus are provided.
Note
Do not rush to change the settings. With high probability, the default settings will suit you, or it will be enough to change just a couple of them.
Image settings
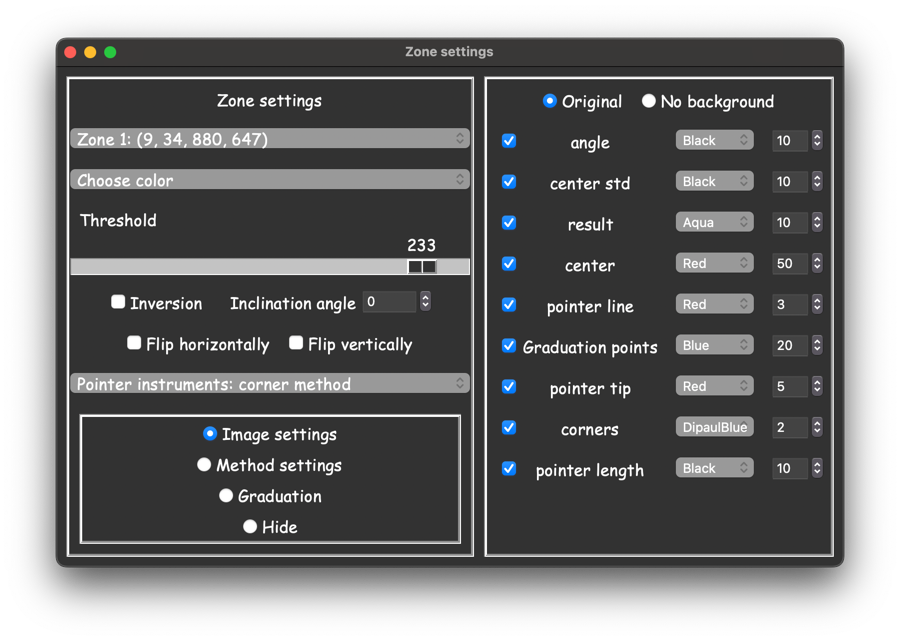
The radio buttons Original and No background allow you to choose which image will be displayed in the zone. Original shows the source image with objects overlaid on it, and No background shows the picture with the background subtracted and with objects overlaid on it.
Note
The No background mode is convenient for tuning the recognition parameters, as it allows controlling all changes in the settings.
The remaining settings of this menu affect only the displaying of various objects and labels on the zone image. For each object in the list you can:
enable/disable displaying
set color
set size
Method settings
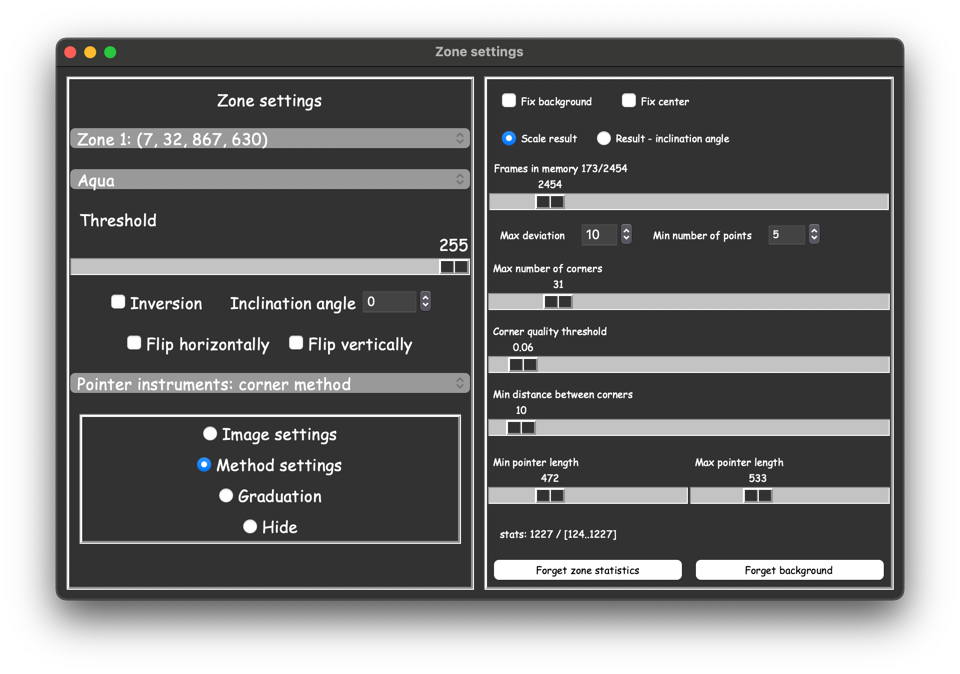
The checkboxes Fix background and Fix center allow you to lock the background and the center (the pointer rotation axis) respectively. New frames will not affect the background or the center coordinates. Fixing the background helps keep the pointer even if it stands still, but even small background changes can accumulate and eventually become critical.
The radio buttons Scale result and Result — inclination angle determine which value is considered the recognition result. If Scale result is selected, then the recognition result will be the value displayed on the scale according to the graduation. If Result — inclination angle is selected, then the recognition result will be the pointer inclination angle; graduation is not considered in this case.
Note
The pointer inclination angle is measured counterclockwise from the horizontal right position and takes values from 0 to 360 degrees.
The Frames in memory value determines how many frames will be stored in memory for processing. The more frames, the better the background is determined and the more statistics of the lines and centers is accumulated, but the higher the requirements for image stability. In other words, with a large number of frames in memory, the program adapts worse to background changes.
To the right of Frames in memory there are two numbers x/y, where x is the number of frames already processed to compute the background, and y is the maximum number of frames that will be stored for the background. When x = y, each new frame replaces the first frame, so the program uses the last x frames to compute the background unless Fix background is enabled.
Note
When this value is changed, the data about the previous frames that are needed to determine the background is erased. The background calculation starts from scratch. You should not change this value during measurements.
The Max deviation value (in pixels) is involved in two places:
When constructing the line that describes the pointer, only such corners (feature points) are taken that lie no farther than this value.
When searching for the line that describes the pointer for a new frame, this line cannot lie farther than the found center.
In other words, the smaller the Max deviation, the smaller the expected dispersion of the center (the intersection of the pointers in different positions).
Note
After each new frame in which the line describing the pointer was found, the value of the center is refined. Thus, if the measuring instrument smoothly moves in the frame, the center also moves. But if a large shift occurred (by a value larger than Max deviation), then the new center will not be found at all. In this case, you should start processing from the beginning using the Forget zone statistics button. Also, the background data is not saved when saving the zone settings, so if you open previously saved zone settings, give the program time to compute the background.
Min number of points determines the minimum number of corners (feature points) that must be present to construct the pointer line.
Max number of corners determines the maximum number of corners (feature points) that can be found in one frame.
Corner quality threshold sets the minimum corner quality below which points will not be considered.
Min distance between corners (in pixels) sets the minimum distance between corners. After the function finds candidates for corners, it removes those that are too close to each other — closer than the value of Min distance between corners pixels.
Min pointer length and Max pointer length (in pixels) set the minimum and maximum length of the pointer line, which helps filter out false lines.
The label stats: x / [y…z] informs the user about the sample size of the detected pointer lines (there can be no more than one pointer per frame) that are used to compute the center as the intersection of these lines. x is the current number of detected pointer lines, y is the minimum sample size required to compute the center (that is, if x < y, the program will not compute the center at all), and z is the maximum possible sample size. If x = z, each new line replaces the oldest line in the sample. Thus, the program remembers the last x pointer lines when the center is not fixed.
The Forget zone statistics button allows you to forget all the found lines and centers in previous frames and start processing from the beginning. This may be necessary in case of significant changes in the image, for example, if the measuring instrument was moved, the lighting changed, or for some reason the center was found incorrectly.
The Forget background button lets you recompute the background from scratch, which is useful if the background changes abruptly.
Note
For correct calculation of the center in the first seconds of the program’s operation or after pressing the Forget zone statistics button, the pointer should change its inclination angle, preferably across the entire range. The program needs some time to find the center. This time is larger the larger the Frames in memory value is.
Graduation
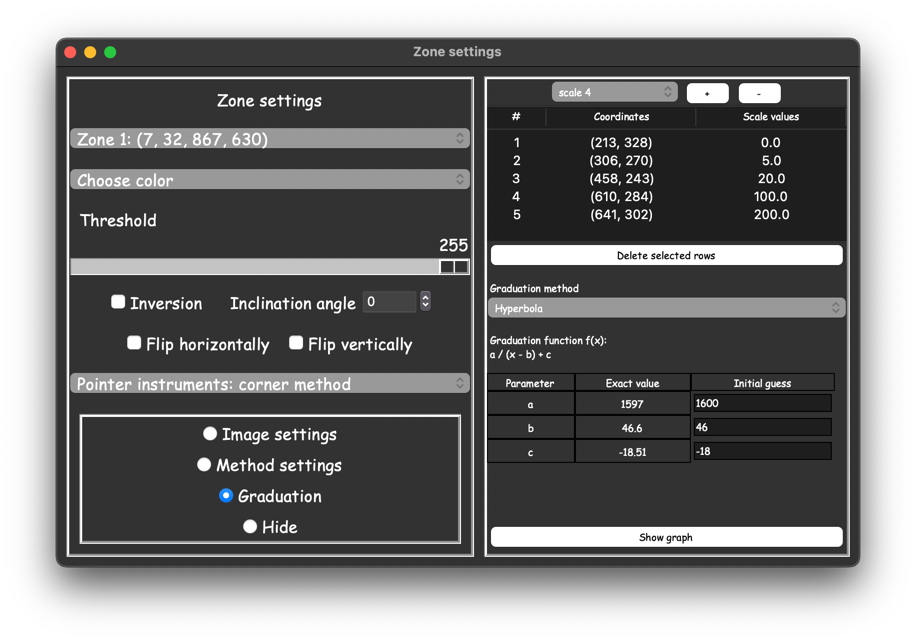
The Graduation menu is used to relate the pointer inclination angle to scale measurements.
You can configure several scales for a single zone and switch between them whenever necessary. For this purpose, the top part of the menu contains the scale list and the + and - buttons. The + button creates a new scale as a copy of the current one, the - button deletes the current scale if it is not the last one, and the drop-down list lets you switch between existing scales.
Note
You can also switch between scales using external commands (see External Programs), which lets you prepare all required scales in advance and then run measurements without pauses.
When the Graduation menu is open, hover the cursor over the scale ticks and click the left mouse button. New graduation points will appear on the image, and they are also displayed in the table of this menu. To relate these points to the scale values, hover the cursor in the table over the cells of the Scale values column and double-click the left mouse button, after which an input field will open. Enter the scale value for this point.
Note
To set a graduation point on a tick as accurately as possible, zoom in the image (see Position and size control).
To delete unnecessary points, select the corresponding rows in the table and click Delete selected rows (you can use the ctrl and shift keys when selecting).
Next, select the appropriate graduation method from the Graduation method list.
All methods can be divided into two groups: splines (i.e., a function whose domain is divided into a finite number of intervals on each of which it coincides with a certain algebraic polynomial) and functions with an explicit analytical expression.
The following belong to splines:
Piecewise linear interpolation
Cubic spline
Lagrange interpolation polynomial
No additional settings are required for them. You can learn more about them in mathematics and numerical methods literature; within this documentation there is no need to provide detailed explanations of these methods.
The following belong to functions with an explicit analytical expression:
Linear dependence
Logarithmic dependence
Hyperbola
User function
When any of these methods is selected, you will see the explicit function expression that will be used for graduation, where the variable x is the angle in degrees, and the remaining parameters (any letters except x) will be found automatically. Sometimes the program cannot independently compute exact values of the parameters (especially when using complex functions and a large number of parameters). In this case, you will need to enter an Initial guess for all or at least some of the parameters. In general, even if the program automatically finds the parameter values, it will not hurt to enter initial guesses approximately equal to the found parameters, as this will simplify further calculations.
When choosing the User function method, you must enter the function expression yourself: use x to denote the variable (it must be present) and any other letters or words to denote the free parameters to be computed. A wide set of mathematical functions and operators is also available in conventional notation.
If the function expression is incorrect or does not contain the variable x, this will be reported above the input line, and the text will be highlighted in red.
Note
The function expression may not contain parameters at all and will not depend on graduation points. For example, you can use the quirky function mod(90 - x, 360) / 6 to convert the inclination angle of a second hand to seconds (the function mod(a, b) returns the remainder of dividing a by b).
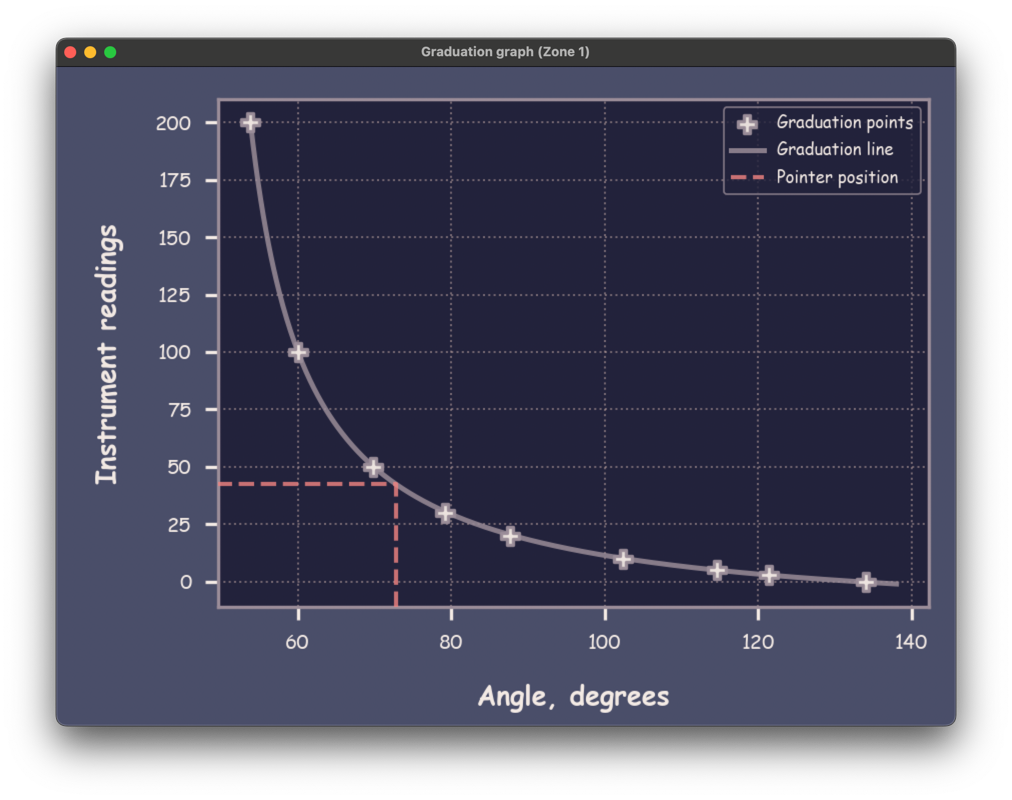
When you click the Show graph button, a window with the graduation graph for the current zone opens. It updates in real time and also shows the current results. The menu of this window has a File section in which you can save the graph to the default directory (see Program Directory) using the Save button or choose a path to save using Save as…
Note
The graduation graph is not updated if the program does not find a recognition result. Thus, if you changed the graduation graph, it will only update after the first found recognition result.
Pointer instruments: contour method
The principle of this method is similar to Pointer instruments: corner method with the only difference that instead of corners the algorithm finds contours and searches for the pointer line over all points of the found pointer contour. In this regard, this method has slightly different settings.
Note
The presence of several methods makes the program more versatile. In some cases one method works better; in others, another.
Image settings
The image settings are the same as in the angle method (see Image settings), with the only difference that instead of corners, contours are displayed.
Method settings
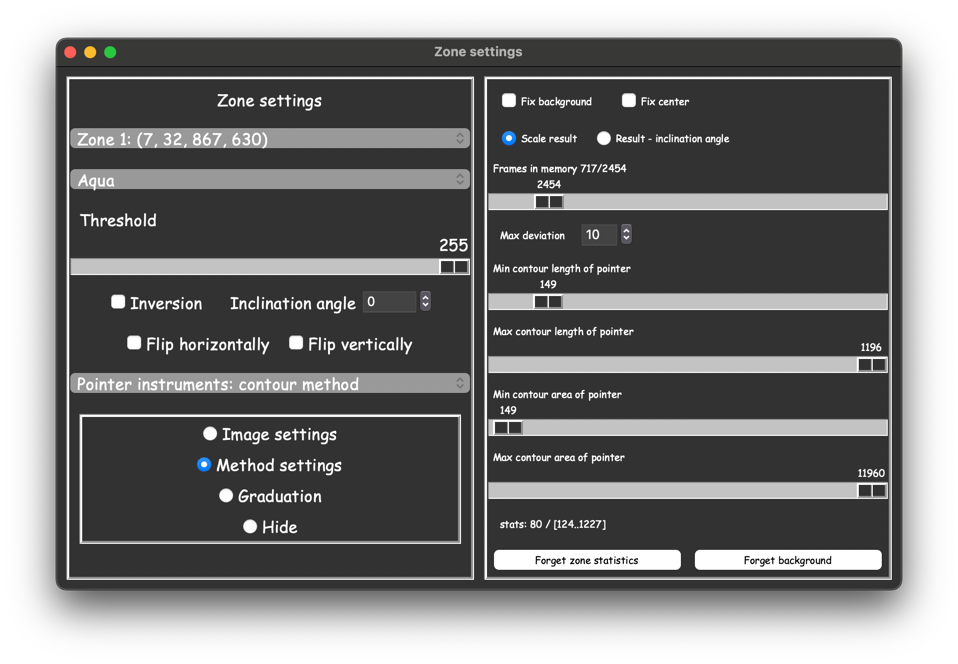
The contour method settings have the same variables as the angle method settings (see Method settings) with the same purpose:
Fix background and Fix center checkboxes
Radio buttons Scale result and Result — inclination angle
Frames in memory
Max deviation
As well as several new variables (measured in pixels):
Min contour length of pointer
Max contour length of pointer
Min contour area of pointer
Max contour area of pointer
These act as filters for contour lengths and areas, allowing you to find the desired pointer contour in the frame.
Graduation
Exactly the same settings as in the angle method (see Graduation).
Pointer instruments: color method
The principle of this method is also similar to Pointer instruments: corner method, but has more significant differences:
In this method, the background is also determined, but not relative to a moving object, rather as pixels filtered by colors.
The pointer line is constructed over the filtered pixels. The straight line is searched for so that as many filtered pixels as possible lie no farther than Max deviation pixels from the line.
Further, the principle of operation is the same.
Note
This method is ideal for measuring instruments (and there are quite a few of them) whose pointer has a distinctive color, for example, red. This allows the pointer to be filtered by color and to work only with it.
Image settings
The image settings are the same as in the angle method (see Image settings) with the only difference that there are no corners in this method.
Method settings
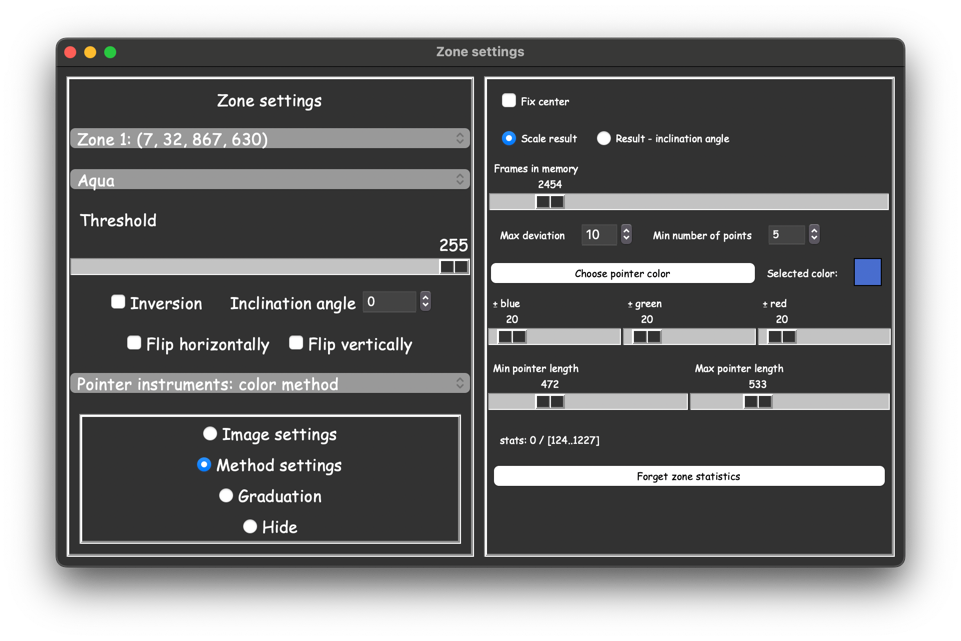
The color method settings have the same variables as the angle method settings (see Method settings) with the same purpose:
Fix center checkbox
Radio buttons Scale result and Result — inclination angle
Frames in memory
Max deviation
Min number of points
Min/Max pointer length
As well as several new buttons and variables:
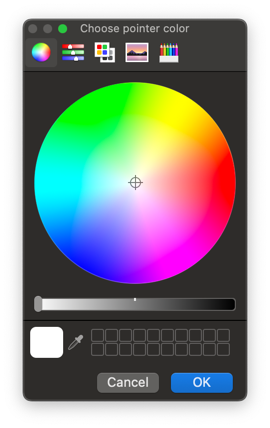
Choose pointer color which opens a color selection window where you can choose the pointer color. To the right of it a square with the selected color is displayed.
Three sliders to configure the color range of the pointer (red, green, blue). How it works: each pixel of a color image is defined by three numbers from 0 to 255 (red, green, blue). For the selected color, defined by three numbers (x, y, z), the sliders allow setting the range (x ± dx, y ± dy, z ± dz), where dx, dy, dz are the slider values. Everything outside of this range will be considered background.
Note
Manually setting the pointer color can be very inconvenient, so you can simply hover the cursor over the pointer in the image and click the left mouse button. In this case, the pointer color will be selected automatically. At the same time, the Method settings menu must be open. Thus, the described logic duplicates the eyedropper tool.
Note that the eyedropper also works in the color setup window, which opens when you click the Choose pointer color button, but not on the Windows operating system.
Graduation
Exactly the same settings as in the angle method (see Graduation).
Neural network
The neural network recognizes printed text in Russian and English perfectly. Optionally, other languages can be connected — contact the developers for this. The neural network recognizes standard fonts well, but updates results less frequently than the 7-segment method and recognizes fonts used in digital displays much worse.
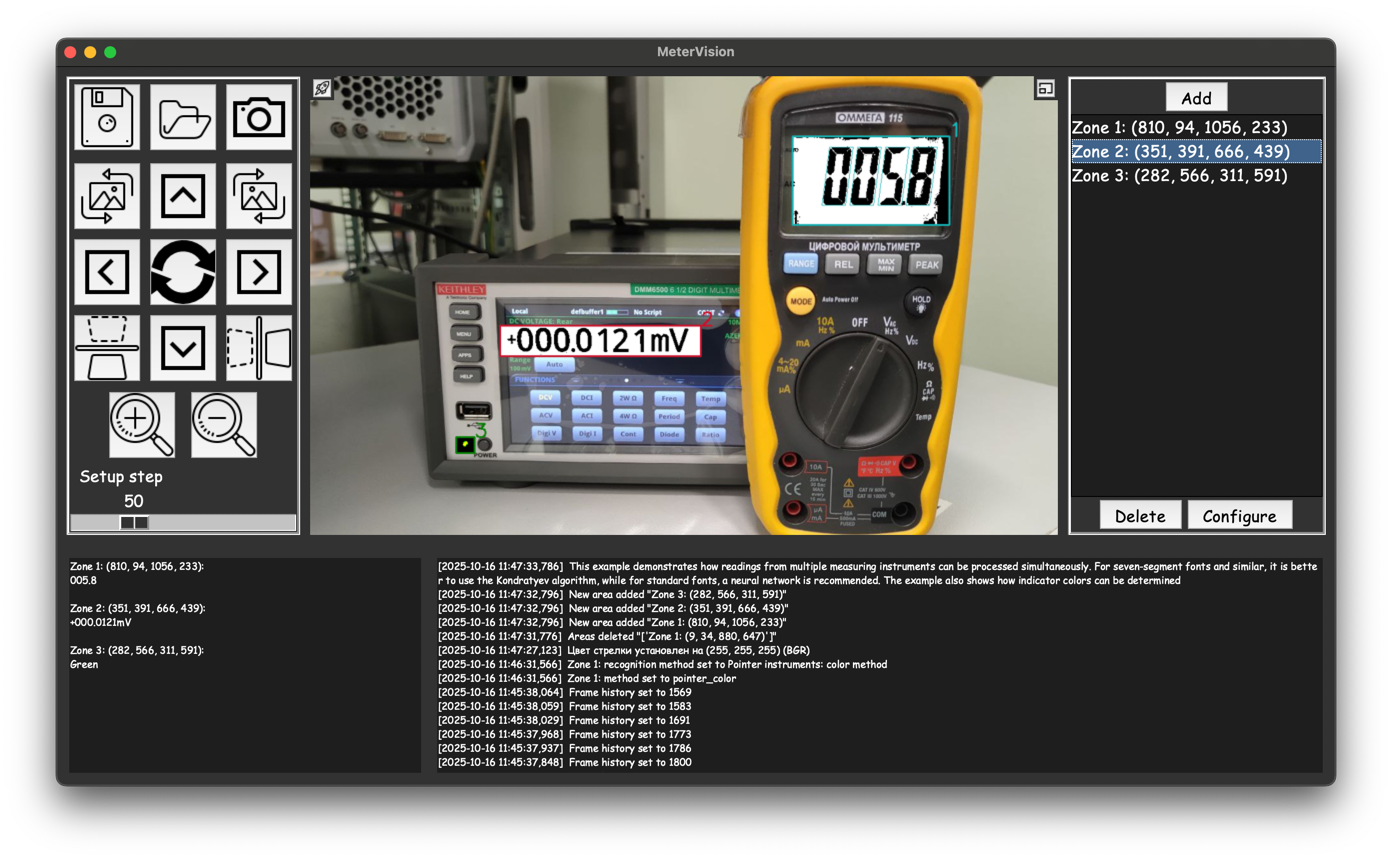
In the image, the neural network processes zone 2
Note
For the neural network to work, you also need to install the Tesseract-OCR program and specify the path to the executable file in Main menu → Settings → Connect neural network….
QR and barcodes
This method recognizes QR codes and barcodes (linear and 2D formats supported by the zxing-cpp library) inside the selected zone. If several codes are found in the zone, each result is shown on a separate line.
Note
The Threshold slider does not affect this method. You can use the Inversion checkbox if needed. For reliable recognition, codes should be clearly visible in the zone, without strong glare or blur.
Indicators
This method is used to determine the colors of the image. It can be useful if you need to track the indication of any devices. For example, if a red emergency lamp lights up on the panel of your device, you can configure the launch of an external safety program.
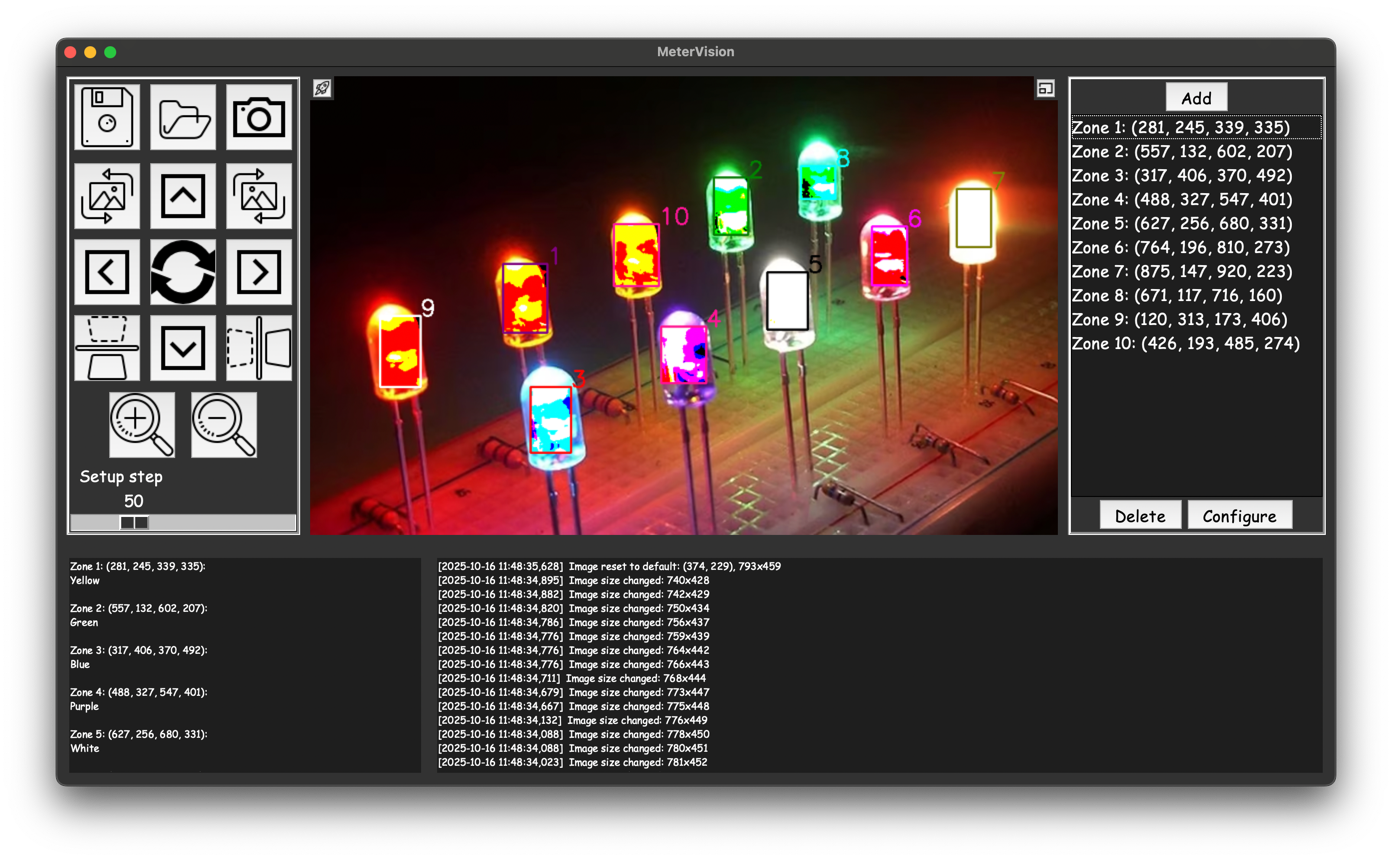
In the settings of this method, there is also a Threshold slider and an Inversion checkbox, but unlike the methods 7-segment and neural network, which work with grayscale images, this method processes the image simultaneously across three channels (red, green, blue).
Note
For example, if the threshold is set to 100 and some image pixel has values (90, 150, 200) in the RGB palette, then after processing this pixel will have the value (0, 255, 255), which corresponds to cyan. And applying inversion will convert this pixel to (255, 0, 0), which corresponds to red.
Thus, after processing, only 8 colors remain in the zone processed by the Indicators method. And the same 8 colors can be recognized for each zone. The Color sensitivity slider determines which color will be recognized for the given zone.
Note
Color sensitivity determines what percentage of pixels of each color must be in the zone to consider that this color is indeed present there.
For example, if the sensitivity is 100, then 1 pixel of each color is enough to consider that this color is in the zone; therefore, the color result of the zone with such sensitivity will always be white (mixing red, green, and blue yields white).
If the sensitivity is 0, then at least 100 percent of the pixels of each color must be present to consider that the color is there; therefore, the result will always be black.
Intermediate values allow cutting off unnecessary colors.